eBPF(extended Berkeley Packet Filter),ebpf 支持程序在不修改内核源码,或添加额外内核模块情况下运行,添加内核新功能。

架构

用户态

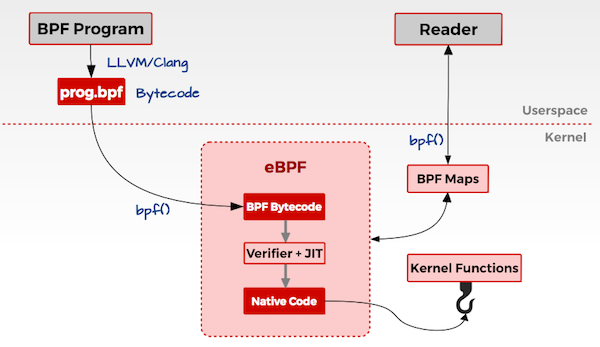
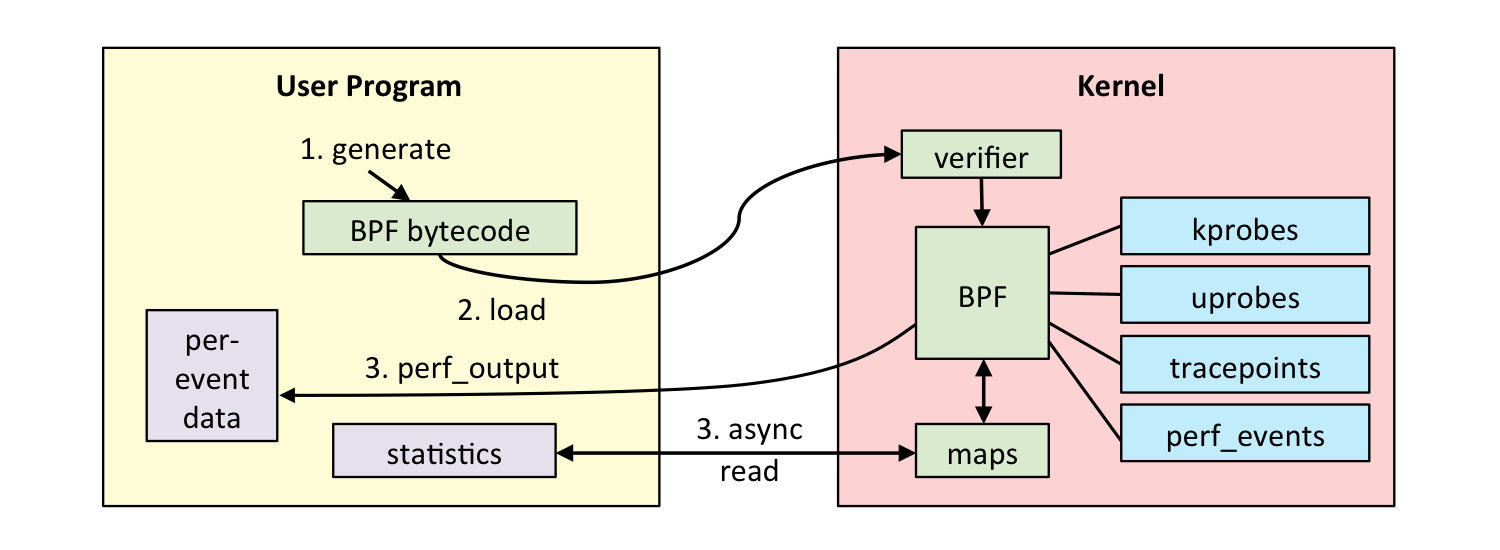
  • 用户编写 ebpf 程序,可使用 ebpf 汇编或者 ebpf 特有 c 语言编写;
  • 使用 llvm/clang 编译器,将 ebpf 程序编译为 ebpf 字节码;
  • 调用 bpf() 系统调用将 eBPF 字节码加载到内核

内核态

  • ebpf 字节码到内核时,内核会先对其进行安全验证;
  • 使用 JIT (Just In Time)将 字节码编译为本地机器码;
  • 根据 eBPF 程序功能,将机器码挂载到内核的不同运行路径上(例如跟踪内核运行状态的ebpf 程序会挂载在 kprobes 的运行路径上)。当内核运行到这些路径上,就会触发执行相应路径上的 eBPF 机器码;

原文拿来和 JAVA 的 AOP 概念做类比,这里由于本人没有 java 基础,所以不再赘述,感觉只是挂钩函数功能而已,欢迎评论区指正 orz…

根据挂载点功能不同,可以分为以下几个模块:

  • 性能跟踪;
  • 网络;
  • 容器;
  • 安全

eBPF 使用

编写 eBPF 程序方式有直接汇编,c语言形式,bcc 工具。

bpftrace

下面是一些简单命令用来入门了解,详细文档参考 bpftrace language

One-Liner Tutorial

Lesson 1. Listing Probes
1
bpftrace -l 'tracepoints:syscalls:sys_enter_*'

bpftrace -l 列举所有 probes,然后跟一个搜索字段

Lesson 2. Hello World
1
bpftrace -e 'BEGIN { printf("hello world\n"); }'
  • BEGIN 特殊 probe ,在程序开始时运行,可以用来设置变量以及打印头信息;
  • action {} ,这里调用了 printf 函数
Lesson 3. File Opens
1
2
3
4
5
6
7
# bpftrace -e 'tracepoint:syscalls:sys_enter_openat { printf("%s %s\n", comm, str(args.filename)); }'
Attaching 1 probe...
snmp-pass /proc/cpuinfo
snmp-pass /proc/stat
snmpd /proc/net/dev
snmpd /proc/net/if_inet6
^C
Lesson 4. Syscall Counts By Process
1
2
3
4
5
6
7
8
bpftrace -e 'tracepoint:raw_syscalls:sys_enter { @[comm] = count(); }'
Attaching 1 probe...
^C

@[bpftrace]: 6
@[systemd]: 24
@[snmp-pass]: 96
@[sshd]: 125

总结进程进行系统调用的次数

  • @:表示 map 特殊变量类型,可以存储总结数据。可以使用 @name 提高可读性;
  • []:key
  • count():map 类型调用次数计数
Lesson 5. Distributino of read() Bytes
1
2
3
4
5
6
7
8
9
10
11
12
13
# bpftrace -e 'tracepoint:syscalls:sys_exit_read /pid == 18644/ { @bytes = hist(args.ret); }'
Attaching 1 probe...
^C

@bytes:
[0, 1] 12 |@@@@@@@@@@@@@@@@@@@@ |
[2, 4) 18 |@@@@@@@@@@@@@@@@@@@@@@@@@@@@@@@ |
[4, 8) 0 | |
[8, 16) 0 | |
[16, 32) 0 | |
[32, 64) 30 |@@@@@@@@@@@@@@@@@@@@@@@@@@@@@@@@@@@@@@@@@@@@@@@@@@@@|
[64, 128) 19 |@@@@@@@@@@@@@@@@@@@@@@@@@@@@@@@@ |
[128, 256) 1 |@

总结 sys_read() 内核函数的返回值并以直方图格式返回

  • /…/:过滤
  • ret:函数返回值
  • @:map 无key
  • hist:map 函数
Lesson 6. Kernel Dynamic Tracing of read() Bytes
1
2
3
4
5
6
7
8
9
10
11
12
13
14
15
16
17
# bpftrace -e 'kretprobe:vfs_read { @bytes = lhist(retval, 0, 2000, 200); }'
Attaching 1 probe...
^C

@bytes:
(...,0] 0 | |
[0, 200) 66 |@@@@@@@@@@@@@@@@@@@@@@@@@@@@@@@@@@@@@@@@@@@@@@@@@@@@|
[200, 400) 2 |@ |
[400, 600) 3 |@@ |
[600, 800) 0 | |
[800, 1000) 5 |@@@ |
[1000, 1200) 0 | |
[1200, 1400) 0 | |
[1400, 1600) 0 | |
[1600, 1800) 0 | |
[1800, 2000) 0 | |
[2000,...) 39 |@@@@@@@@@@@@@@@@@@@@@@@@@@@@@@ |
  • probe 采用 kretprobe:vfs_read
Lesson 7. Timing read()s
1
2
3
4
5
6
7
8
9
10
11
12
13
14
15
16
17
18
19
20
21
22
23
24
25
26
# bpftrace -e 'kprobe:vfs_read { @start[tid] = nsecs; } kretprobe:vfs_read /@start[tid]/ { @ns[comm] = hist(nsecs - @start[tid]); delete(@start, tid); }'
Attaching 2 probes...

[...]
@ns[snmp-pass]:
[0, 1] 0 | |
[2, 4) 0 | |
[4, 8) 0 | |
[8, 16) 0 | |
[16, 32) 0 | |
[32, 64) 0 | |
[64, 128) 0 | |
[128, 256) 0 | |
[256, 512) 27 |@@@@@@@@@ |
[512, 1k) 125 |@@@@@@@@@@@@@@@@@@@@@@@@@@@@@@@@@@@@@@@@@@@@@ |
[1k, 2k) 22 |@@@@@@@ |
[2k, 4k) 1 | |
[4k, 8k) 10 |@@@ |
[8k, 16k) 1 | |
[16k, 32k) 3 |@ |
[32k, 64k) 144 |@@@@@@@@@@@@@@@@@@@@@@@@@@@@@@@@@@@@@@@@@@@@@@@@@@@@|
[64k, 128k) 7 |@@ |
[128k, 256k) 28 |@@@@@@@@@@ |
[256k, 512k) 2 | |
[512k, 1M) 3 |@ |
[1M, 2M) 1 | |

总结消耗在 read() 上的 时间。

Lesson 8. Count Process-Level Events
1
2
3
4
5
6
7
8
9
10
11
12
13
# bpftrace -e 'tracepoint:sched:sched* { @[probe] = count(); } interval:s:5 { exit(); }'
Attaching 25 probes...
@[tracepoint:sched:sched_wakeup_new]: 1
@[tracepoint:sched:sched_process_fork]: 1
@[tracepoint:sched:sched_process_exec]: 1
@[tracepoint:sched:sched_process_exit]: 1
@[tracepoint:sched:sched_process_free]: 2
@[tracepoint:sched:sched_process_wait]: 7
@[tracepoint:sched:sched_wake_idle_without_ipi]: 53
@[tracepoint:sched:sched_stat_runtime]: 212
@[tracepoint:sched:sched_wakeup]: 253
@[tracepoint:sched:sched_waking]: 253
@[tracepoint:sched:sched_switch]: 510
  • sched:sched 类型 probe
  • probe:当前 probe 全名
  • intervals:s:5:持续5s
  • exit():退出bpftrace
Lesson 9. Profile On-CPU Kernel Stacks
1
2
3
4
5
6
7
8
9
10
11
12
13
14
15
16
17
18
19
20
# bpftrace -e 'profile:hz:99 { @[kstack] = count(); }'
Attaching 1 probe...
^C

[...]
@[
filemap_map_pages+181
__handle_mm_fault+2905
handle_mm_fault+250
__do_page_fault+599
async_page_fault+69
]: 12
[...]
@[
cpuidle_enter_state+164
do_idle+390
cpu_startup_entry+111
start_secondary+423
secondary_startup_64+165
]: 22122
  • profile:hz:99:设置cpu为99hz。需要足够的cpu时间来捕获执行,但又不能影响执行。100可能与lockstep或其他定时活动冲突,故选择99
  • kstack:内核函数调用栈
Lesson10. Scheduler Tracing
1
2
3
4
5
6
7
8
9
10
11
12
13
14
15
16
17
18
19
20
21
22
# bpftrace -e 'tracepoint:sched:sched_switch { @[kstack] = count(); }'
^C
[...]

@[
__schedule+697
__schedule+697
schedule+50
schedule_timeout+365
xfsaild+274
kthread+248
ret_from_fork+53
]: 73
@[
__schedule+697
__schedule+697
schedule_idle+40
do_idle+356
cpu_startup_entry+111
start_secondary+423
secondary_startup_64+165
]: 305

过滤了 上下文切换的 events。

Lesson 11. Block I/O Tracing
1
2
3
4
5
6
7
8
9
10
11
12
13
14
15
16
17
18
19
20
21
22
23
24
# bpftrace -e 'tracepoint:block:block_rq_issue { @ = hist(args.bytes); }'
Attaching 1 probe...
^C

@:
[0, 1] 1 |@@ |
[2, 4) 0 | |
[4, 8) 0 | |
[8, 16) 0 | |
[16, 32) 0 | |
[32, 64) 0 | |
[64, 128) 0 | |
[128, 256) 0 | |
[256, 512) 0 | |
[512, 1K) 0 | |
[1K, 2K) 0 | |
[2K, 4K) 0 | |
[4K, 8K) 24 |@@@@@@@@@@@@@@@@@@@@@@@@@@@@@@@@@@@@@@@@@@@@@@@@@@@@|
[8K, 16K) 2 |@@@@ |
[16K, 32K) 6 |@@@@@@@@@@@@@ |
[32K, 64K) 5 |@@@@@@@@@@ |
[64K, 128K) 0 | |
[128K, 256K) 1 |@@ |

块设备 I/O 请求

  • tracepoint:block:block类型的 tracepoint
  • block_rq_issue:当设备存在 I/O 时触发
  • args.bytes:block_rq_issue 的参数,请求的字节大小
Lesson 12. Kernel Struct Tracing
1
2
3
4
5
6
7
8
9
10
11
12
13
14
15
16
17
# cat path.bt
#ifndef BPFTRACE_HAVE_BTF
#include <linux/path.h>
#include <linux/dcache.h>
#endif

kprobe:vfs_open
{
printf("open path: %s\n", str(((struct path *)arg0)->dentry->d_name.name));
}

# bpftrace path.bt
Attaching 1 probe...
open path: dev
open path: if_inet6
open path: retrans_time_ms
[...]

跟踪了 vfs_open() 内核函数,并解析其 第一个参数 struct path *。

  • kprobe
  • arg0:自带变量,表示第一个参数
  • ((struct path *)arg0)->dentry->d_name.name:将 arg0 转换为 struct path 类型。
  • #include 包含含有 struct path 定义的文件。

bcc

bcc 工具安装命令

1
sudo pacman -S bcc bcc-tools python-bcc

Lesson 1. hello world

运行以下 hello world python 程序

1
2
3
4
5
6
7
8
9
10
11
12
13
14
15
16
17
18
#!/usr/bin/python

# run in project examples directory with:
# sudo ./hello_world.py"
# see trace_fields.py for a longer example

from bcc import BPF

prog = """
int hello(void *ctx) {
bpf_trace_printk("Hello, World!\\n");
return 0;
}
"""

b = BPF(text=prog)
b.attach_kprobe(event="__x64_sys_clone", fn_name="hello")
b.trace_print()
  • text='...':定义了 BPF 程序。c语言;
  • kprobe__sys_clone():基于 kprobes,如果函数定义前缀为 kprobe__,剩下的则被认为是要插桩的内核函数,(上例中没有用到,因为较新内核中clone为__x64_sys_clone,而其会自动修正为sys_clone导致报错)
  • void *ctx:ctx 保存了 参数,但是由于这里没有使用,直接转换为 void 类型;
  • bpf_trace_printk():内核打印函数,基于trace_pipe。但本身参数存在限制,最多3个参数,只能有一个%s,并且 trace_pipe全局共享。更好的调用接口是BPF_PERF_OUTPUT
  • return 0:必要的格式,并且 内核内部对不同返回值有不同处理逻辑,未定义会导致UB行为
  • .trace_print:bcc 例程读取 trace_pipe 并打印输出

Lesson 2. sys_sync()

仿照前面 hello world 编写即可

1
2
3
4
5
6
7
8
9
10
11
12
13
from bcc import BPF

prog = """
int kprobe__ksys_sync(void *ctx) {
bpf_trace_printk("sys_sync() called\\n");

return 0;
}
"""

print("Tracing sys_sync()... Ctrl-C to end")
b = BPF(text=prog).trace_print()

Lesson 3. hello_fields.py

1
2
3
4
5
6
7
8
9
10
11
12
13
14
15
16
17
18
19
20
21
22
23
24
25
26
27
28
from bcc import BPF
from bcc.utils import printb

# define BPF program
prog = """
int hello(void *ctx){
bpf_trace_printk("Hello, World!\\n");
return 0;
}
"""

# load BPF program
b = BPF(text=prog)
b.attach_kprobe(event="__x64_sys_clone", fn_name="hello")

# header
print("%-18s %-16s %-6s %s" % ("TIME(S)", "COMM", "PID", "MESSAGE"))

# format output
while 1:
try:
(task, pid, cpu, flags, ts, msg) = b.trace_fields()
except ValueError:
continue
except KeyboardInterrupt:
exit()
printb(b"%-18.9f %-16s %-6d %s" % (ts, task, pid, msg))

trace 与 hello_world 类似,但加了一些新东西:

  • prog = :定义 c 程序为 prog 变量
  • hello():使用自定义函数名,而非kprobe__。BPF c 程序中的所有 c 函数会在 probe 中执行,因此他们会将 pt_reg* ctx 作为第一个参数。如果不需要执行,需要定义为static inline,有时候需要__always_inline属性。
  • b.attach_kprobe(event="__x64_sys_clone", fn_name="hello"):创建一个 kprobe。可以多次 attach_kprobe,也可以将一个 c 函数 attach 到多个内核函数中。
  • b.trace_fields:返回 trace_pipe 中的固定字段集合。类似于 trace_print()。

Lesson 4. sync_timing.py

过去 sync 实现是异步的,导致 系统管理员会连敲三个sync命令等待完成,再 reboot,有人sync; sync; sync 这个不会等待直接执行,自然起不到等待sync的作用。现在 sync 是同步实现,会阻塞(不过运行很快)。

sync_timing.py 实现了 trace sync 并检测命令间隔运行是否超过 1s。

1
2
3
4
5
6
7
8
9
10
11
12
13
14
15
16
17
18
19
20
21
22
23
24
25
26
27
28
29
30
31
32
33
34
35
36
37
38
39
40
41
42
43
44
45
46
47
48
from __future__ import print_function
from bcc import BPF
from bcc.utils import printb

# load BPF program
b = BPF(
text="""
#include <uapi/linux/ptrace.h>

BPF_HASH(last);

int do_trace(struct pt_regs *ctx) {
u64 ts, *tsp, delta, key = 0;

// attempt to read stored timestamp
tsp = last.lookup(&key);
if (tsp != NULL) {
delta = bpf_ktime_get_ns() - *tsp;
if (delta < 1000000000) {
// output if time is less than 1 second
bpf_trace_printk("%d\\n", delta / 1000000);
}
last.delete(&key);
}

// update stored timestamp
ts = bpf_ktime_get_ns();
last.update(&key, &ts);
return 0;
}
"""
)

b.attach_kprobe(event="ksys_sync", fn_name="do_trace")
print("Tracing for quick sync's... Ctrl-C to end")

# format output
start = 0
while 1:
try:
(task, pid, cpu, flags, ts, ms) = b.trace_fields()
if start == 0:
start = ts
ts = ts - start
printb(b"At time %.2f s: multiple syncs detected, last %s ms ago" % (ts, ms))
except KeyboardInterrupt:
exit()

  • bpf_ktime_get_ns():返回当前纳秒级时间戳
  • BPF_HASH(last):创建一个 BPF map 对象 (hash表)。默认 key value 类型为 u64。
  • key=0:这里只使用了 key = 0 的情况。
  • last.lookup(&key):在 hash 表中查询 key,如果存在返回指向该值的指针。否则为空。参数为 key 的指针地址
  • if (tsp != NULL) {:bpf 的 verifier 要求从 lookup 获取的指针变量必须检查是否为空。以防空指针引用
  • last.delete(&key):删除 key。这里先删除再update是由于 4.8.10 内核版本 update 函数存在 bug,新版本注释改行无影响
  • last.update(&key, &ts):修改 key 对应的 value。

Lesson 5. sync_count.py

修改 sync_timing.py,令其能够保存所有的 kernel sync 系统调用,以 hash map 结构存储

1
2
3
4
5
6
7
8
9
10
11
12
13
14
15
16
17
18
19
20
21
22
23
24
25
26
27
28
29
30
31
32
33
34
35
36
37
38
39
40
41
42
43
44
45
46
47
48
49
50
51
52
53
54
55
56
57
58
59
60
61
62
63
64
65
66
67
68
69
from __future__ import print_function
from bcc import BPF
from bcc.utils import printb

# load BPF program
b = BPF(
text="""
#include <uapi/linux/ptrace.h>

BPF_ARRAY(idx, u64, 1);
BPF_ARRAY(last_idx, u64, 1);
BPF_HASH(last);

int do_trace(struct pt_regs *ctx) {
u64 ts, *tsp, delta, *idxp, idx_val, *last_idxp, last_idx_val = 0;
int zero = 0;
// read current idx & last_idx
idxp = idx.lookup(&zero);
if (!idxp)
return 0;
idx_val = *idxp;

last_idxp = last_idx.lookup(&zero);
if (!last_idxp)
return 0;
last_idx_val = *last_idxp;

// attempt to read stored timestamp
tsp = last.lookup(&last_idx_val);
if (tsp != NULL) {
delta = bpf_ktime_get_ns() - *tsp;
if (delta < 1000000000) {
// output if time is less than 1 second
bpf_trace_printk("%d %d\\n", last_idx_val, delta / 1000000);
}
}

// update stored timestamp
ts = bpf_ktime_get_ns();
last.update(&idx_val, &ts);
last_idx.update(&zero, &idx_val);
idx_val++;
idx.update(&zero, &idx_val);
return 0;
}
"""
)

b.attach_kprobe(event="ksys_sync", fn_name="do_trace")
print("Tracing for quick sync's... Ctrl-C to end")

# format output
start = 0
while 1:
try:
(task, pid, cpu, flags, ts, msg) = b.trace_fields()
if start == 0:
start = ts
ts = ts - start
print(f"[Debug] msg: {msg}")
key = msg.split(b" ")[0]
ms = msg.split(b" ")[1]
printb(
b"At time %.2f s: multiple syncs detected, key %s, last %s ms ago"
% (ts, key, ms)
)
except KeyboardInterrupt:
exit()

Lesson 6. disksnoop.py

1
2
3
4
5
6
7
8
9
10
11
12
13
14
15
16
17
18
19
20
21
22
23
24
25
26
27
28
29
30
31
32
33
34
35
36
37
38
39
40
41
42
43
44
45
46
47
48
49
50
51
52
53
54
55
56
57
58
59
60
61
62
63
64
65
66
67
68
69
70
71
72
73
74
75
76
77
78
79
80
81
82
83
#!/usr/bin/python3
#
# disksnoop.py Trace block device I/O: basic version of iosnoop.
# For Linux, uses BCC, eBPF. Embedded C.
#
# Written as a basic example of tracing latency.
#
# Copyright (c) 2015 Brendan Gregg.
# Licensed under the Apache License, Version 2.0 (the "License")
#
# 11-Aug-2015 Brendan Gregg Created this.

from __future__ import print_function
from bcc import BPF
from bcc.utils import printb

REQ_WRITE = 1 # from include/linux/blk_types.h

# load BPF program
b = BPF(
text="""
#include <uapi/linux/ptrace.h>
#include <linux/blk-mq.h>

BPF_HASH(start, struct request *);

void trace_start(struct pt_regs *ctx, struct request *req) {
// stash start timestamp by request ptr
u64 ts = bpf_ktime_get_ns();

start.update(&req, &ts);
}

void trace_completion(struct pt_regs *ctx, struct request *req) {
u64 *tsp, delta;

tsp = start.lookup(&req);
if (tsp != 0) {
delta = bpf_ktime_get_ns() - *tsp;
bpf_trace_printk("%d %x %d\\n", req->__data_len,
req->cmd_flags, delta / 1000);
start.delete(&req);
}
}
"""
)

# if BPF.get_kprobe_functions(b"blk_start_request"):
# b.attach_kprobe(event="blk_start_request", fn_name="trace_start")
b.attach_kprobe(event="blk_mq_start_request", fn_name="trace_start")

# if BPF.get_kprobe_functions(b"__blk_account_io_done"):
# # __blk_account_io_done is available before kernel v6.4.
# b.attach_kprobe(event="__blk_account_io_done", fn_name="trace_completion")
# elif BPF.get_kprobe_functions(b"blk_account_io_done"):
# # blk_account_io_done is traceable (not inline) before v5.16.
# b.attach_kprobe(event="blk_account_io_done", fn_name="trace_completion")
# else:
# b.attach_kprobe(event="blk_mq_end_request", fn_name="trace_completion")

b.attach_kprobe(event="blk_mq_end_request", fn_name="trace_completion")

# header
print("%-18s %-2s %-7s %8s" % ("TIME(s)", "T", "BYTES", "LAT(ms)"))

# format output
while 1:
try:
(task, pid, cpu, flags, ts, msg) = b.trace_fields()
(bytes_s, bflags_s, us_s) = msg.split()

if int(bflags_s, 16) & REQ_WRITE:
type_s = b"W"
elif bytes_s == "0": # see blk_fill_rwbs() for logic
type_s = b"M"
else:
type_s = b"R"
ms = float(int(us_s, 10)) / 1000

printb(b"%-18.9f %-2s %-7s %8.2f" % (ts, type_s, bytes_s, ms))
except KeyboardInterrupt:
exit()

  • REQ_WRTIE:python中定义内核常量,用于后续比较;
  • trace_start(struct pt_regs *ctx, struct request *req):参数ctx用于寄存器以及 BPF 上下文,实际参数req,req为 attach 函数 blk_start_request 的实际参数。
  • start.update(&req, &ts):以 struct 结构体作为 key,常见的可以作为 key 的还有 thread id。
  • req->_data_len:可以解引用 struct request 的成员。bcc 是通过封装 bpf_probe_read_kernel 函数来实现的,也可以自行调用来实现。
  • if BPF.get_kprobe_functions(b'__blk_account_io_done'):...:根据 kernel 版本来选择不同 attach 的函数。

Lesson 7. hello_perf_output.py

使用 BPF_PERF_OUTPUT() 接口而不是 bpf_trace_printk
hello_perf_output.py

1
2
3
4
5
6
7
8
9
10
11
12
13
14
15
16
17
18
19
20
21
22
23
24
25
26
27
28
29
30
31
32
33
34
35
36
37
38
39
40
41
42
43
44
45
46
47
48
49
50
51
52
53
54
from bcc import BPF

# define BPF program
prog = """
#include <linux/sched.h>

// define output data structure in C
struct data_t {
u32 pid;
u64 ts;
char comm[TASK_COMM_LEN];
};
BPF_PERF_OUTPUT(events);

int hello(struct pt_regs *ctx) {
struct data_t data = {};

data.pid = bpf_get_current_pid_tgid();
data.ts = bpf_ktime_get_ns();
bpf_get_current_comm(&data.comm, sizeof(data.comm));

events.perf_submit(ctx, &data, sizeof(data));

return 0;
}
"""

# load BPF program
b = BPF(text=prog)
b.attach_kprobe(event="__x64_sys_clone", fn_name="hello")

# header
print("%-18s %-16s %-6s %s" % ("TIME(s)", "COMM", "PID", "MESSAGE"))

# process event
start = 0


def print_event(cpu, data, size):
global start
event = b["events"].event(data)
if start == 0:
start = event.ts
time_s = (float(event.ts - start)) / 1000000000
print(
"%-18.9f %-16s %-6d %s" % (time_s, event.comm, event.pid, "Hello, perf_output!")
)


# loop with callback to print_event
b["events"].open_perf_buffer(print_event)
while 1:
b.perf_buffer_poll()

  • struct data_t:定义了要返回给用户空间的结构体;
  • BPF_PERF_OUTPUT:命名了通信信道 events
  • struct data_t data = {};:初始化;
  • bpf_get_current_pid_tgid():返回进程id(低四字节)以及线程组id(高四字节)
  • bpf_get_current_comm():返回进程命令
  • events.perf_submit:通过 perf ring buffer 提交 event 到用户空间
  • def print_event():定义可以处理 event 流的函数
  • b["events"].event(data):获取 perf 返回 event作为一个 python 对象。
  • b["events"].open_perf_buffer(print_event):将events 与 print_event 函数联系
  • while1: b.perf_buffer_poll(),阻塞等待 events

Lesson 8. sync_perf_output.py

重写 sync_timing.py

1
2
3
4
5
6
7
8
9
10
11
12
13
14
15
16
17
18
19
20
21
22
23
24
25
26
27
28
29
30
31
32
33
34
35
36
37
38
39
40
41
42
43
44
45
46
47
48
49
50
51
52
53
54
55
56
57
58
59
60
61
62
63
64
65
66
67
68
69
70
71
from __future__ import print_function
from bcc import BPF
from bcc.utils import printb

prog = """
#include <uapi/linux/ptrace.h>
#include <linux/sched.h>

// define output data structure in C
struct data_t {
u32 pid;
u64 ts;
u64 delta;
char comm[TASK_COMM_LEN];
};
BPF_PERF_OUTPUT(events);
BPF_HASH(last);

int do_trace(struct pt_regs *ctx) {
u64 ts, *tsp, delta, key = 0;
struct data_t data = {};

data.pid = bpf_get_current_pid_tgid();
data.ts = bpf_ktime_get_ns();
bpf_get_current_comm(&data.comm, sizeof(data.comm));

// attempt to read stored timestamp
tsp = last.lookup(&key);
if (tsp != NULL) {
delta = bpf_ktime_get_ns() - *tsp;
if (delta < 1000000000) {
// output if time is less than 1 second
data.delta = delta / 1000000;
events.perf_submit(ctx, &data, sizeof(data));
}
}

// update stored timestamp
ts = bpf_ktime_get_ns();
last.update(&key, &ts);
return 0;
}
"""

# load BPF program
b = BPF(text=prog)

b.attach_kprobe(event="ksys_sync", fn_name="do_trace")
print("Tracing for quick sync's... Ctrl-C to end")

# format output
start = 0


def print_event(cpu, data, size):
global start
event = b["events"].event(data)
if start == 0:
start = event.ts
time_s = (float(event.ts - start)) / 1000000000
print(
"At time %.2f s: multiple syncs detected, last %s ms ago"
% (time_s, event.delta)
)


# loop with callback to print_event
b["events"].open_perf_buffer(print_event)
while 1:
b.perf_buffer_poll()

Lesson 9. bitehist.py

直方图输出工具

1
2
3
4
5
6
7
8
9
10
11
12
13
14
15
16
17
18
19
20
21
22
23
24
25
26
27
28
29
30
31
32
33
34
35
36
37
38
39
40
41
42
43
44
45
46
47
48
49
50
51
52
53
54
55
56
57
58
59
60
61
62
63
64
65
66
#!/usr/bin/python3
#
# bitehist.py Block I/O size histogram.
# For Linux, uses BCC, eBPF. Embedded C.
#
# Written as a basic example of using histograms to show a distribution.
#
# A Ctrl-C will print the gathered histogram then exit.
#
# Copyright (c) 2015 Brendan Gregg.
# Licensed under the Apache License, Version 2.0 (the "License")
#
# 15-Aug-2015 Brendan Gregg Created this.
# 03-Feb-2019 Xiaozhou Liu added linear histogram.
# 02-Mar-2025 Wei Use blk_mq_end_request for newer kernel.

from __future__ import print_function
from bcc import BPF
from time import sleep

# load BPF program
b = BPF(
text="""
#include <uapi/linux/ptrace.h>
#include <linux/blk-mq.h>

BPF_HISTOGRAM(dist);
BPF_HISTOGRAM(dist_linear);

int trace_req_done(struct pt_regs *ctx, struct request *req)
{
dist.increment(bpf_log2l(req->__data_len / 1024));
dist_linear.increment(req->__data_len / 1024);
return 0;
}
"""
)

# if BPF.get_kprobe_functions(b"__blk_account_io_done"):
# # __blk_account_io_done is available before kernel v6.4.
# b.attach_kprobe(event="__blk_account_io_done", fn_name="trace_req_done")
# elif BPF.get_kprobe_functions(b"blk_account_io_done"):
# # blk_account_io_done is traceable (not inline) before v5.16.
# b.attach_kprobe(event="blk_account_io_done", fn_name="trace_req_done")
# else:
# b.attach_kprobe(event="blk_mq_end_request", fn_name="trace_req_done")
#
b.attach_kprobe(event="blk_mq_end_request", fn_name="trace_req_done")
# header
print("Tracing... Hit Ctrl-C to end.")

# trace until Ctrl-C
try:
sleep(99999999)
except KeyboardInterrupt:
print()

# output
print("log2 histogram")
print("~~~~~~~~~~~~~~")
b["dist"].print_log2_hist("kbytes")

print("\nlinear histogram")
print("~~~~~~~~~~~~~~~~")
b["dist_linear"].print_linear_hist("kbytes")

Lesson 10. disklatency.py

根据 disksnoop.py 以及 bitehist.py 编写程序,此处略

Lesson 11. vfsreadlat.py

分离 python 以及 c,通过 BPF(src_file="")实现

Lesson 12. setuid_monitor.py

1
2
3
4
5
6
7
8
9
10
11
12
13
14
15
16
17
18
19
20
21
22
23
24
25
26
27
28
29
30
31
32
33
34
35
36
37
38
39
40
41
42
43
44
45
46
47
48
49
from __future__ import print_function
from bcc import BPF
from bcc.utils import printb

# define BPF program
b = BPF(text="""
#include <linux/sched.h>

// define output data structure in C
struct data_t {
u32 pid;
u32 uid;
u64 ts;
char comm[TASK_COMM_LEN];
};
BPF_PERF_OUTPUT(events);

TRACEPOINT_PROBE(syscalls, sys_enter_setuid) {
struct data_t data = {};

// Check /sys/kernel/debug/tracing/events/syscalls/sys_enter_setuid/format
// for the args format
data.uid = args->uid;
data.ts = bpf_ktime_get_ns();
data.pid = bpf_get_current_pid_tgid();
bpf_get_current_comm(&data.comm, sizeof(data.comm));

events.perf_submit(args, &data, sizeof(data));

return 0;
}
""")

# header
print("%-14s %-12s %-6s %s" % ("TIME(s)", "COMMAND", "PID", "UID"))

def print_event(cpu, data, size):
event = b["events"].event(data)
printb(b"%-14.3f %-12s %-6d %d" % ((event.ts/1000000000),
event.comm, event.pid, event.uid))

# loop with callback to print_event
b["events"].open_perf_buffer(print_event)
while 1:
try:
b.perf_buffer_poll()
except KeyboardInterrupt:
exit()

  • TRACEPOINT_PROBE(syscalls, sys_enter_setuid) tracepoint 提供了稳定的 api,(例如 sys_enter_setuid),因此可以尽量使用 tracepoint 而非 kprobe。通过 perf list 查找可用 tracepoints
  • args->uid:args 为 tracepoint 提供的。定义文件位置如下,setuid 情况只有 uid 一个成员会被打印
    1
    2
    3
    4
    5
    6
    7
    8
    9
    10
    11
    ❯ sudo cat /sys/kernel/tracing/events/syscalls/sys_enter_setuid/format
    name: sys_enter_setuid
    ID: 204
    format:
    field:unsigned short common_type; offset:0; size:2; signed:0;
    field:unsigned char common_flags; offset:2; size:1; signed:0;
    field:unsigned char common_preempt_count; offset:3; size:1; signed:0;
    field:int common_pid; offset:4; size:4; signed:1;
    field:int __syscall_nr; offset:8; size:4; signed:1;
    field:uid_t uid; offset:16; size:8; signed:0;
    print fmt: "uid: 0x%08lx", ((unsigned long)(REC->uid))
  • BPF_PERF_OUTPUT perf_submit 第一个参数为 args

Lesson 13. disksnoop.py fixed

Lesson 14. strlen_count.py

对用户空间的函数进行插桩,strlen()

1
2
3
4
5
6
7
8
9
10
11
12
13
14
15
16
17
18
19
20
21
22
23
24
25
26
27
28
29
30
31
32
33
34
35
36
37
38
39
40
41
42
43
44
45
46
47
48
from __future__ import print_function
from bcc import BPF
from time import sleep

# load BPF program
b = BPF(
text="""
#include <uapi/linux/ptrace.h>

struct key_t {
char c[80];
};
BPF_HASH(counts, struct key_t);

int count(struct pt_regs *ctx) {
if (!PT_REGS_PARM1(ctx))
return 0;

struct key_t key = {};
u64 zero = 0, *val;

bpf_probe_read_user(&key.c, sizeof(key.c), (void *)PT_REGS_PARM1(ctx));
// could also use `counts.increment(key)`
val = counts.lookup_or_try_init(&key, &zero);
if (val) {
(*val)++;
}
return 0;
};
"""
)
b.attach_uprobe(name="c", sym="strlen", fn_name="count")

# header
print("Tracing strlen()... Hit Ctrl-C to end.")

# sleep until Ctrl-C
try:
sleep(99999999)
except KeyboardInterrupt:
pass

# print output
print("%10s %s" % ("COUNT", "STRING"))
counts = b.get_table("counts")
for k, v in sorted(counts.items(), key=lambda counts: counts[1].value):
print('%10d "%s"' % (v.value, k.c.encode("string-escape")))

  • PT_REGS_PARM1(ctx):获取strlen()的第一个参数
  • b.attach_uprobe(name="c", sym="strlen", fn_name="count"):挂载到库”c”,如果挂载 main 主程序,填入其 “pathname”。

Lesson 15. nodejs_http_server.py(USDT)

usdt(user statically-defined tracing)
##0## Lesson 16. task_switch.c
暂略

C程序编写

首先有一个最小的 bpf 库:

1
2
3
4
5
6
7
8
9
10
11
12
13
14
15
16
17
18
19
20
21
22
23
24
25
26
27
28
29
30
31
32
33
34
35
36
37
38
39
40
41
42
43
44
45
46
47
48
49
50
51
52
53
54
55
56
57
58
59
60
61
62
63
64
65
66
67
68
69
70
71
72
73
74
75
76
77
78
79
80
81
82
83
84
85
86
87
88
89
90
91
92
93
94
95
96
97
98
99
100
101
102
103
104
105
106
107
108
109
110
111
112
113
114
115
116
117
118
119
120
121
122
123
124
125
126
127
128
129
130
131
132
133
134
135
136
137
138
139
140
141
142
143
144
145
146
147
148
149
150
151
152
153
154
155
156
157
158
159
160
161
162
163
164
165
166
167
168
169
170
171
172
173
174
175
176
177
178
179
180
181
182
183
184
185
186
187
188
189
190
191
192
193
194
195
196
197
198
199
/* eBPF instruction mini library */
#ifndef __BPF_INSN_H
#define __BPF_INSN_H

struct bpf_insn;

/* ALU ops on registers, bpf_add|sub|...: dst_reg += src_reg */

#define BPF_ALU64_REG(OP, DST, SRC) \
((struct bpf_insn){.code = BPF_ALU64 | BPF_OP(OP) | BPF_X, \
.dst_reg = DST, \
.src_reg = SRC, \
.off = 0, \
.imm = 0})

#define BPF_ALU32_REG(OP, DST, SRC) \
((struct bpf_insn){.code = BPF_ALU | BPF_OP(OP) | BPF_X, \
.dst_reg = DST, \
.src_reg = SRC, \
.off = 0, \
.imm = 0})

/* ALU ops on immediates, bpf_add|sub|...: dst_reg += imm32 */

#define BPF_ALU64_IMM(OP, DST, IMM) \
((struct bpf_insn){.code = BPF_ALU64 | BPF_OP(OP) | BPF_K, \
.dst_reg = DST, \
.src_reg = 0, \
.off = 0, \
.imm = IMM})

#define BPF_ALU32_IMM(OP, DST, IMM) \
((struct bpf_insn){.code = BPF_ALU | BPF_OP(OP) | BPF_K, \
.dst_reg = DST, \
.src_reg = 0, \
.off = 0, \
.imm = IMM})

/* Short form of mov, dst_reg = src_reg */

#define BPF_MOV64_REG(DST, SRC) \
((struct bpf_insn){.code = BPF_ALU64 | BPF_MOV | BPF_X, \
.dst_reg = DST, \
.src_reg = SRC, \
.off = 0, \
.imm = 0})

#define BPF_MOV32_REG(DST, SRC) \
((struct bpf_insn){.code = BPF_ALU | BPF_MOV | BPF_X, \
.dst_reg = DST, \
.src_reg = SRC, \
.off = 0, \
.imm = 0})

/* Short form of mov, dst_reg = imm32 */

#define BPF_MOV64_IMM(DST, IMM) \
((struct bpf_insn){.code = BPF_ALU64 | BPF_MOV | BPF_K, \
.dst_reg = DST, \
.src_reg = 0, \
.off = 0, \
.imm = IMM})

#define BPF_MOV32_IMM(DST, IMM) \
((struct bpf_insn){.code = BPF_ALU | BPF_MOV | BPF_K, \
.dst_reg = DST, \
.src_reg = 0, \
.off = 0, \
.imm = IMM})

/* BPF_LD_IMM64 macro encodes single 'load 64-bit immediate' insn */
#define BPF_LD_IMM64(DST, IMM) BPF_LD_IMM64_RAW(DST, 0, IMM)

#define BPF_LD_IMM64_RAW(DST, SRC, IMM) \
((struct bpf_insn){.code = BPF_LD | BPF_DW | BPF_IMM, \
.dst_reg = DST, \
.src_reg = SRC, \
.off = 0, \
.imm = (__u32)(IMM)}), \
((struct bpf_insn){.code = 0, /* zero is reserved opcode */ \
.dst_reg = 0, \
.src_reg = 0, \
.off = 0, \
.imm = ((__u64)(IMM)) >> 32})

#ifndef BPF_PSEUDO_MAP_FD
#define BPF_PSEUDO_MAP_FD 1
#endif

/* pseudo BPF_LD_IMM64 insn used to refer to process-local map_fd */
#define BPF_LD_MAP_FD(DST, MAP_FD) \
BPF_LD_IMM64_RAW(DST, BPF_PSEUDO_MAP_FD, MAP_FD)

/* Direct packet access, R0 = *(uint *) (skb->data + imm32) */

#define BPF_LD_ABS(SIZE, IMM) \
((struct bpf_insn){.code = BPF_LD | BPF_SIZE(SIZE) | BPF_ABS, \
.dst_reg = 0, \
.src_reg = 0, \
.off = 0, \
.imm = IMM})

/* Memory load, dst_reg = *(uint *) (src_reg + off16) */

#define BPF_LDX_MEM(SIZE, DST, SRC, OFF) \
((struct bpf_insn){.code = BPF_LDX | BPF_SIZE(SIZE) | BPF_MEM, \
.dst_reg = DST, \
.src_reg = SRC, \
.off = OFF, \
.imm = 0})

/* Memory store, *(uint *) (dst_reg + off16) = src_reg */

#define BPF_STX_MEM(SIZE, DST, SRC, OFF) \
((struct bpf_insn){.code = BPF_STX | BPF_SIZE(SIZE) | BPF_MEM, \
.dst_reg = DST, \
.src_reg = SRC, \
.off = OFF, \
.imm = 0})

/* Atomic memory add, *(uint *)(dst_reg + off16) += src_reg */

#define BPF_STX_XADD(SIZE, DST, SRC, OFF) \
((struct bpf_insn){.code = BPF_STX | BPF_SIZE(SIZE) | BPF_XADD, \
.dst_reg = DST, \
.src_reg = SRC, \
.off = OFF, \
.imm = 0})

/* Memory store, *(uint *) (dst_reg + off16) = imm32 */

#define BPF_ST_MEM(SIZE, DST, OFF, IMM) \
((struct bpf_insn){.code = BPF_ST | BPF_SIZE(SIZE) | BPF_MEM, \
.dst_reg = DST, \
.src_reg = 0, \
.off = OFF, \
.imm = IMM})

/* Conditional jumps against registers, if (dst_reg 'op' src_reg) goto pc +
* off16 */

#define BPF_JMP_REG(OP, DST, SRC, OFF) \
((struct bpf_insn){.code = BPF_JMP | BPF_OP(OP) | BPF_X, \
.dst_reg = DST, \
.src_reg = SRC, \
.off = OFF, \
.imm = 0})

/* Like BPF_JMP_REG, but with 32-bit wide operands for comparison. */

#define BPF_JMP32_REG(OP, DST, SRC, OFF) \
((struct bpf_insn){.code = BPF_JMP32 | BPF_OP(OP) | BPF_X, \
.dst_reg = DST, \
.src_reg = SRC, \
.off = OFF, \
.imm = 0})

/* Conditional jumps against immediates, if (dst_reg 'op' imm32) goto pc + off16
*/

#define BPF_JMP_IMM(OP, DST, IMM, OFF) \
((struct bpf_insn){.code = BPF_JMP | BPF_OP(OP) | BPF_K, \
.dst_reg = DST, \
.src_reg = 0, \
.off = OFF, \
.imm = IMM})

/* Like BPF_JMP_IMM, but with 32-bit wide operands for comparison. */

#define BPF_JMP32_IMM(OP, DST, IMM, OFF) \
((struct bpf_insn){.code = BPF_JMP32 | BPF_OP(OP) | BPF_K, \
.dst_reg = DST, \
.src_reg = 0, \
.off = OFF, \
.imm = IMM})

#define BPF_CALL_FUNC(FUNC) \
((struct bpf_insn){.code = BPF_JMP | BPF_CALL | BPF_K, \
.dst_reg = 0, \
.src_reg = 0, \
.off = 0, \
.imm = FUNC})

/* Raw code statement block */

#define BPF_RAW_INSN(CODE, DST, SRC, OFF, IMM) \
((struct bpf_insn){ \
.code = CODE, .dst_reg = DST, .src_reg = SRC, .off = OFF, .imm = IMM})

/* Program exit */

#define BPF_EXIT_INSN() \
((struct bpf_insn){.code = BPF_JMP | BPF_EXIT, \
.dst_reg = 0, \
.src_reg = 0, \
.off = 0, \
.imm = 0})

#endif

另外还有一些 main.c 中可用的模板函数:

1
2
3
4
5
6
7
8
9
10
11
12
13
14
15
16
17
18
19
20
21
22
23
24
25
26
27
28
29
30
31
32
33
34
35
36
37
38
39
40
41
42
43
44
45
46
47
48
49
50
51
52
53
54
55
56
57
58
59
60
61
62
63
64
65
66
67
68
69
70
71
72
73
74
75
76
77
78
79
80
81
82
83
84
85
86
87
88
89
90
91
92
93
94
95
96
97
98
99
100
101
102
103
104
105
106
107
108
109
110
111
112
113
114
115
116
117
118
119
120
121
122
123
124
125
126
127
128
129
130
131
132
133
134
135
136
137
138
#include "bpf_insn.h"
#include <fcntl.h>
#include <linux/bpf.h>
#include <stdint.h>
#include <stdio.h>
#include <stdlib.h>
#include <string.h>
#include <sys/socket.h>
#include <sys/stat.h>
#include <sys/types.h>
#include <syscall.h>
#include <unistd.h>

#include <stdint.h>


int bpf(int cmd, union bpf_attr *attr) {
return syscall(__NR_bpf, cmd, attr, sizeof(*attr));
}

int bpf_prog_load(union bpf_attr *attr) { return bpf(BPF_PROG_LOAD, attr); }

int bpf_map_create(uint32_t key_size, uint32_t value_size,
uint32_t max_entries) {
union bpf_attr attr = {.map_type = BPF_MAP_TYPE_ARRAY,
.key_size = key_size,
.value_size = value_size,
.max_entries = max_entries};

return bpf(BPF_MAP_CREATE, &attr);
}

int bpf_map_update_elem(int map_fd, uint64_t key, uint64_t *value,
uint64_t flags) {
union bpf_attr attr = {.map_fd = map_fd,
.key = (uint64_t)&key,
.value = (uint64_t)value,
.flags = flags};

return bpf(BPF_MAP_UPDATE_ELEM, &attr);
}

uint64_t bpf_map_lookup_elem(int map_fd, uint32_t key, int index) {
uint64_t value[0x150 / 8] = {};

union bpf_attr attr = {
.map_fd = map_fd,
.key = (uint64_t)&key,
.value = (uint64_t)&value,
};

bpf(BPF_MAP_LOOKUP_ELEM, &attr);
return value[index];
}

uint64_t bpf_map_lookup_key(int map_fd, uint32_t key, void *value) {
union bpf_attr attr = {
.map_fd = map_fd,
.key = (uint64_t)&key,
.value = (uint64_t)value,
};

return bpf(BPF_MAP_LOOKUP_ELEM, &attr);
}

uint64_t bpf_map_update_key(int map_fd, uint32_t key, void *value,
uint64_t flags) {
union bpf_attr attr = {.map_fd = map_fd,
.key = (uint64_t)&key,
.value = (uint64_t)value,
.flags = flags};

return bpf(BPF_MAP_UPDATE_ELEM, &attr);
}

uint64_t bpf_map_push(int map_fd, void *value, uint64_t flags) {
union bpf_attr attr = {
.map_fd = map_fd, .key = 0, .value = (uint64_t)value, .flags = flags};

return bpf(BPF_MAP_UPDATE_ELEM, &attr);
}

union bpf_attr *create_bpf_prog(struct bpf_insn *insns, unsigned int insn_cnt) {
union bpf_attr *attr = (union bpf_attr *)malloc(sizeof(union bpf_attr));

attr->prog_type = BPF_PROG_TYPE_SOCKET_FILTER;
attr->insn_cnt = insn_cnt;
attr->insns = (uint64_t)insns;
attr->license = (uint64_t)"";

return attr;
}

int socks[2] = {-1};

int attach_socket(int prog_fd) {
if (socks[0] == -1 && socketpair(AF_UNIX, SOCK_DGRAM, 0, socks) < 0) {
perror("socketpair");
exit(1);
}

if (setsockopt(socks[0], SOL_SOCKET, SO_ATTACH_BPF, &prog_fd,
sizeof(prog_fd)) < 0) {
perror("setsockopt");
exit(1);
}
}

void setup_bpf_prog(struct bpf_insn *insns, size_t insncnt) {
union bpf_attr *prog = create_bpf_prog(insns, insncnt);
int prog_fd = bpf_prog_load(prog);

if (prog_fd < 0) {
perror("prog_load");
exit(1);
}

attach_socket(prog_fd);
}

void run_bpf_prog(struct bpf_insn *insns, size_t insncnt) {
int val = 0;

setup_bpf_prog(insns, insncnt);
write(socks[1], &val, sizeof(val));
}

void write_file(char *filename, char *content) {
int fd = open(filename, O_RDWR | O_CREAT);
if (fd < 0) {
fprintf(stderr, "invalid open\n");
return;
}
write(fd, content, strlen(content));
close(fd);
return;
}

BPF中的寄存器为 BPF_REG_R0-10 其中 R0 为结果寄存器,R1-R3 为参数寄存器,R10 为栈帧寄存器。

BPF Verifier

Verifier 为抽象解释器,不关注变量实际取值,而是将目标作为一个变量范围表示。因此其 ebpf 代码存在很多限制,例如 算术右移操作的右值必须为常数 src_is_const,如果为变量,则其右移后的值会变得无法预测。
如下,在 verifier 中,实际会使用 umin_value 来右移,这里如果我们设置右值变量 [0, 1], dst_reg 为常数 1,则会导致 dst_regs 在 verifier 中变为 1,而在真实执行中如果我们设置了右值变量为1,就会导致 dst_regs 值为0,从而可以导致后面更大的混淆以及利用。

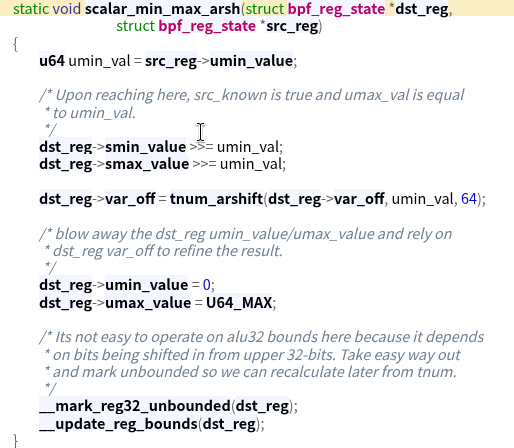
一般就是出现混淆后,构造 verifier 认为为0,但实际上非0的情况,然后可以将其作为偏移写入目标 BPF_MAP 对象的 max_entries 以及 index_mask 字段,从而可以对 MAP 对象的任意 index 做读写

参考链接